aganmo

BRANDING - RAVEN STUDIO

Star INSURANCE SUBSCRIPTION
PREDICTION Star

YEAR

2023

CLIENT

HRS

SERVICES

DATA ANALYSIS & MACHINE LEARNING

PROJECT

INSURANCE

📂 STATA SOURCE CODE
🎯 Description & Objectives

In this project, I analyzed data related to the coverage of complementary health insurance using a dataset from the Health and Retirement Study (HRS) using the statistical software for Data Science (STATA).

The goal of the study was to evaluate the determinants influencing the demand for health insurance subscription (insurance: subscription = 1 and non-subscription = 0) based on a sample of 3,206 individuals.

Key Explanatory Variables:
  • Retire: Retirement status (1 = yes, 0 = no)
  • Hstatusg: Health status (1 = poor, 0 = good)
  • Gender: (1 = female, 0 = male)
  • Chronic: Total number of chronic diseases
  • Linc: Household income (log-transformed)
  • Age: Age of the individual
🔍 TEST OF INDEPENDENCE ON QUALITATIVE VARIABLES

The threshold is higher than the probability (0.000), meaning the result is significant. There is a correlation between the decision to subscribe to health insurance and retirement status.

The threshold is higher than the probability (0.000), meaning the result is significant. There is a correlation between the decision to subscribe to health insurance and gender.

The threshold is higher than the probability (0.000), meaning the result is significant. There is a correlation between the decision to subscribe to health insurance and health status.

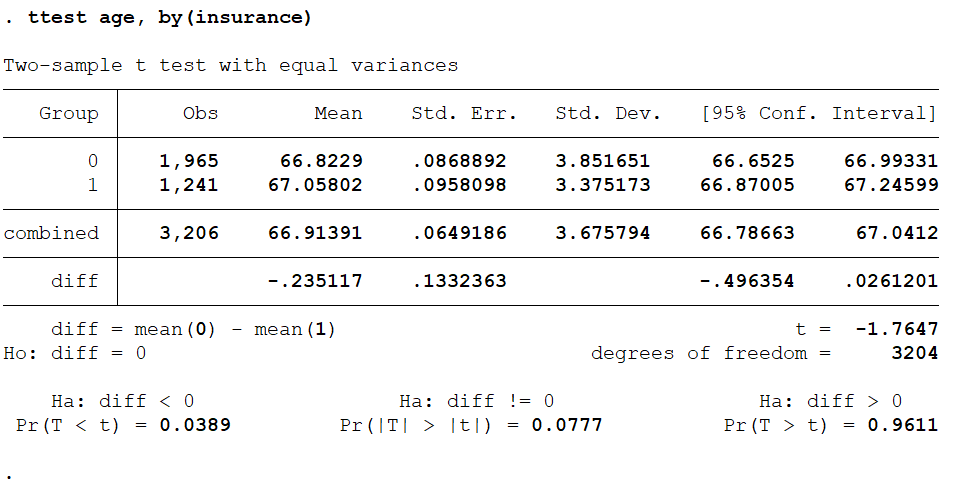
📊 MEAN COMPARISON TEST

The total number of chronic diseases significantly affects the decision to subscribe to health insurance.

The probability is lower than the threshold (Pr(|T| > |t|) = 0.0046), indicating a difference in the means between the two groups, meaning there is a correlation between the decision to subscribe to health insurance and the total number of chronic diseases.

Household income (log-transformed) significantly affects the decision to subscribe to health insurance.

The probability is lower than the threshold (Pr(|T| > |t|) = 0.0000), showing a difference in the means between the two groups, meaning there is a correlation between the decision to subscribe to health insurance and household income (logarithmic).

Age does not significantly affect the decision to subscribe to health insurance.

The probability is higher than the threshold (Pr(|T| > |t|) = 0.0777), meaning there is no significant difference in the means between the two groups, and there is no correlation between the decision to subscribe to health insurance and age.

📈 LOGIT MODEL ESTIMATION

A Logit model was estimated to predict health insurance subscription levels based on the proposed explanatory factors. The “gender” variable was removed since its probability was higher than the threshold.

🔍 RESULTS ANALYSIS

The Chi-square probability is significant (0.0000 < threshold). Thus, we reject the null hypothesis (H0) that all coefficients are zero and accept the alternative hypothesis (H1). The model is globally significant, but the R² is 8.27%, indicating the model’s explanatory power is not strong.

  • The retirement status variable is a positive explanatory factor: non-retirees are more likely to subscribe to health insurance.
  • The health status variable is a positive explanatory factor: healthier individuals are more likely to subscribe to health insurance.
  • The income variable is a positive explanatory factor: higher household income increases the likelihood of subscribing to health insurance.
  • The chronic diseases variable is a positive explanatory factor: the higher the number of chronic diseases, the higher the likelihood of subscribing to health insurance.
⚖️ CALCULATING MARGINAL EFFECTS


  • The impact coefficient of the “retire” variable on the probability is 0.66.
  • The impact coefficient of the “health status” variable on the probability is 0.076.
  • If the “age” variable increases by one unit, the probability of subscribing to health insurance decreases by 0.005.
  • If the “household income” variable increases by one unit, the probability of subscribing to health insurance increases by 0.18.
  • If the “chronic diseases” variable increases by one unit, the probability of subscribing to health insurance increases by 0.016.
📊 ELASTICITY AND SEMI-ELASTICITY
ELASTICITY

A 1% increase in household income leads to a 164% increase in the probability of subscribing to health insurance.

SEMI-ELASTICITY

Adding one chronic disease increases the probability of subscribing by 4.29%.

🔍 Prediction Quality Analysis and Error Rate

The model correctly predicted 64.25% of cases, with an error rate of 35.75%.

🔢 Forecast

(in terms of probability) for a 70-year-old individual:
Retirement status = yes, gender = male, number of chronic diseases = 2, and household income (log) = 1.9.

INSURANCE = RETIRE + LINC + GENRE + AGE + CHRONIC

log(P(y=1)1P(y=1))=(0.066×1)+(0.18×1.9)+(70×0.05)+(0.016×2)+(0×0.05)

log(P(y=1)1P(y=1))=3.06

P(y=1)1P(y=1)=e3.06

P(y=1)1P(y=1)=0.046887695

P(y=1)=0.0468876950.046887695×P(y=1)

P(y=1)+0.046887695×P(y=1)=0.046887695

P(y=1)(1+0.046887695)=0.046887695

P(y=1)=0.0468876951+0.046887695

P(y=1)=0.0447 or 4.45%

The estimated probability of subscribing to health insurance is 4.45%.